
From My Bookshelf

Current Stuff
Coolest Pic Taken CES 2017 - High Res 3D Printed FaceMini Articles
Adapt or Die - in the past few months I
have witnessed several shifts in
behaviors, discussions and willingness to
modify approaches. It’s very easy to
become stuck in habits that makes one
comfortable but without some level of
discomfort there is likely no growth. This
may be re-tooling, pursuing passions that
enhance understanding of complex
scenarios, or simply scaling back
activities that are not adding meaningful
value.
Assessing Adaptability vs
Variability
iIn my day job, there are hundreds upon thousands controllable and uncontrollable variables in design, hardware and process. Especially when humans are involved. The measure of how we adapt against variance can be overlooked from my experiences. In instances were there are complex trends that point to a need for a adaptation we can some times let our fear of change parallelize our objectivity. One possible solutions I have witnessed some very intelligent peer grad students or co-workers utilize is trend or scenario modeling with variable weighting factors. Most of my leaders in academia and industry are pretty data driven, but an opportunity many of can miss is the rationalization that our predictions could be wrong or flawed. Allowing for confidence levels as a variable factor in modeling future trends is paramount to recoverability and adaptation from disruptions.Welcome
Since 2004 This site has primarily served as a development sandbox to explore design, community service, scripting and research on data visualization against varied data sets. Feel free to explore things I am exploring or have a level of hobbyist enthusiasm. After years of looking at a bare index page I decided to add some navigation for pages of people looking for me on-line or from some random search.. For deeper access ping me.


© DarrellPorcher.com 2004-2020
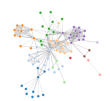
Data Visualization Toolset
As part of some data representation research, someone introduced me to the D3 DOM library for representing data sets visually and interactively. It is very powerful for Business Intelligence. It is by far one of my favorite tools for web based data visualization. You can find the library here and here are some links to some of my first usages of the library. Specifically take a look at the gallery for ideas on the capability. Here is a cool one if you have a little one my youngest is fascinated by the interactivity. At my office we use a similar library for network maps http://bl.ocks.org/mbostock/raw/4062045/


